In this example we show how to draw contour using matplotlib in python
Contour plots which are also called level plots are a way to show a three-dimensional surface on a two-dimensional plane. It graphs two predictor variables X Y on the y-axis and a response variable Z as contours.
These contours are also sometimes called z-slices or iso-response values.
One common usage is to visualize density, altitudes or heights of the mountain as well as in the meteorological department.
Syntax
matplotlib.pyplot.contour(*args, data=None, **kwargs)
Plot contour lines.
Call signature:
contour([X, Y,] Z, [levels], **kwargs)
contour and contourf draw contour lines and filled contours, respectively. Except as noted, function signatures and return values are the same for both versions.
-
Parameters
-
- X, Y – array-like, optional
- The coordinates of the values in Z.
X and Y must both be 2D with the same shape as Z (e.g. created via
numpy.meshgrid), or they must both be 1-D such thatlen(X) == Nis the number of columns in Z andlen(Y) == Mis the number of rows in Z.X and Y must both be ordered monotonically.
If not given, they are assumed to be integer indices, i.e.
X = range(N),Y = range(M). - Z(M, N) – array-like
- The height values over which the contour is drawn.
- levels – int or array-like, optional
- Determines the number and positions of the contour lines / regions.
If an int n, use
MaxNLocator, which tries to automatically choose no more than n+1 “nice” contour levels between vmin and vmax.If array-like, draw contour lines at the specified levels. The values must be in increasing order.
Examples
Basic Example
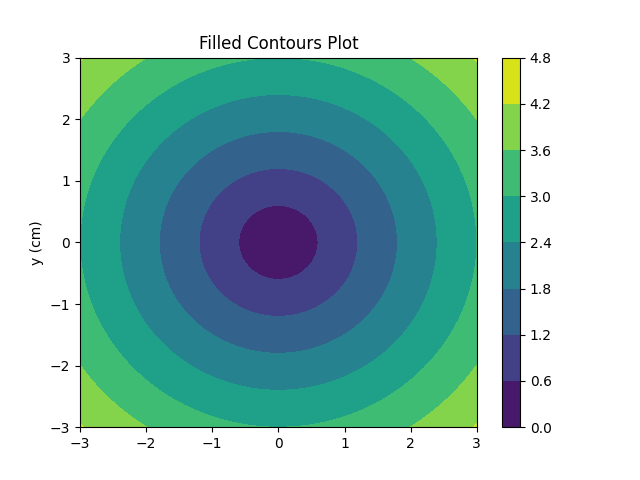
import numpy as np
import matplotlib.pyplot as plot

xlist = np.linspace(-3.0, 3.0, 100)
ylist = np.linspace(-3.0, 3.0, 100)
X, Y = np.meshgrid(xlist, ylist)
Z = np.sqrt(X**2 + Y**2)
fig,ax=plot.subplots(1,1)
cp = ax.contourf(X, Y, Z)
fig.colorbar(cp) # Add a colorbar to a plot

ax.set_title('Filled Contours Plot')
#ax.set_xlabel('x (cm)')
ax.set_ylabel('y (cm)')
plot.show()
This displayed the following
Coloured Example
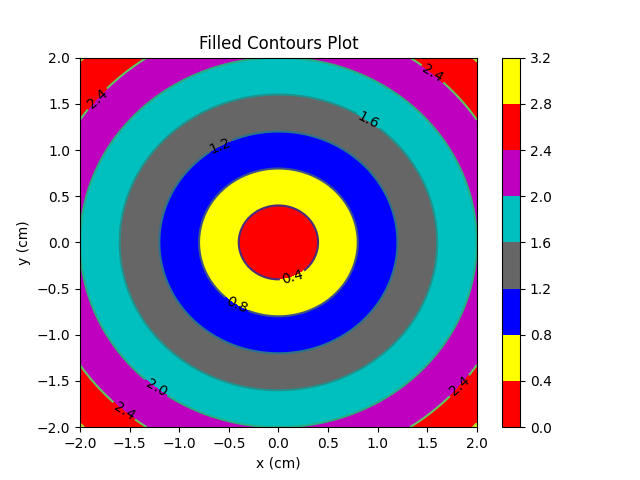
import numpy as np
import matplotlib.pyplot as plot

xlist = np.linspace(-2.0, 2.0, 100)
ylist = np.linspace(-2.0, 2.0, 100)
X, Y = np.meshgrid(xlist, ylist)
Z = np.sqrt(X**2 + Y**2)

plot.figure()

contour = plot.contour(X, Y, Z)
plot.clabel(contour, colors = 'k', fmt = '%2.1f', fontsize=10)
c = ('red', 'yellow', 'blue', '0.4', 'c', 'm')
contour_filled = plot.contourf(X, Y, Z, colors=c)
plot.colorbar(contour_filled)

plot.title('Filled Contours Plot')
plot.xlabel('x (cm)')
plot.ylabel('y (cm)')
plot.show()
This displayed the following
Levels Example
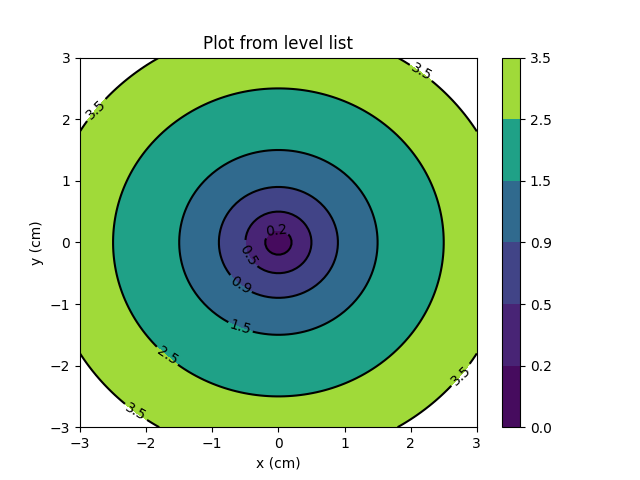
import numpy as np
import matplotlib.pyplot as plot

xlist = np.linspace(-3.0, 3.0, 100)
ylist = np.linspace(-3.0, 3.0, 100)
X, Y = np.meshgrid(xlist, ylist)

Z = np.sqrt(X ** 2 + Y ** 2 )
plot.figure()

levels = [0.0, 0.2, 0.5, 0.9, 1.5, 2.5, 3.5]
contour = plot.contour(X, Y, Z, levels, colors='k')
plot.clabel(contour, colors = 'k', fmt = '%2.1f', fontsize=10)
contour_filled = plot.contourf(X, Y, Z, levels)
plot.colorbar(contour_filled)

plot.title('Plot from level list')
plot.xlabel('x (cm)')
plot.ylabel('y (cm)')
plot.show()
This displayed the following
More examples
Some more examples to try
import matplotlib.pyplot as plot
import numpy as np

xlist = np.linspace(-5.0, 5.0, 100)
ylist = ylist = np.linspace(-5.0, 5.0, 100)
X, Y = np.meshgrid(xlist, ylist)

#creating hyperbolic plane
Z = (X**2)/4 - (Y**2)/9

fig, ax = plot.subplots()

#drawing filled contour plot
cb = ax.contourf(X, Y, Z)
#Adding a colorbar to the plot
fig.colorbar(cb)

ax.set_title('Filled Contour Plot')
ax.set_xlabel('x (cm)')
ax.set_ylabel('y (cm)')

plot.show()