![Java SE 11 Programmer II [1Z0-816] Practice Tests](https://static.shareasale.com/image/43514/728X9026.jpg)
![Java SE 11 Developer (Upgrade) [1Z0-817]](https://static.shareasale.com/image/43514/728X9033.jpg)
![Java SE 11 Programmer I [1Z0-815] Practice Tests](https://static.shareasale.com/image/43514/728X909.jpg)


In this article we take a look at a boxplot in
A box plot or boxplot is a method for graphically demonstrating the locality, spread and skewness groups of numerical data through their quartiles.
In addition to the box on a box plot, there can be lines (which are called whiskers) extending from the box indicating variability outside the upper and lower quartiles, thus, the plot is also termed as the box-and-whisker plot and the box-and-whisker diagram. Outliers that differ significantly from the rest of the dataset may be plotted as individual points beyond the whiskers on the box-plot. Box plots are non-parametric: they display variation in samples of a statistical population without making any assumptions of the underlying statistical distribution. The spacings in each subsection of the box-plot indicate the degree of dispersion (spread) and skewness of the data, which are usually described using the five-number summary.
In addition, the box-plot allows one to visually estimate various L-estimators, notably the interquartile range, midhinge, range, mid-range, and trimean. B
Box plots can be drawn either horizontally or vertically.
Syntax
matplotlib.pyplot.boxplot(data, notch=None, vert=None, patch_artist=None, widths=None)
Parameters
- data: Sequence or array to be plotted
- notch: Accepts boolean values (Optional)
- vert: Accepts boolean values false and true for horizontal and vertical plot respectively (Optional)
- bootstrap: Accepts int specific intervals around notched boxplots.
- usermedians: Array or sequence of dimensions compatible with data
- positions: Array and sets the position of boxes (Optional)
- widths: Array and sets the width of boxes (Optional)
- patch_artist: Boolean values. If
False, produces boxes with the Line2D artist. Otherwise, boxes and drawn with Patch artists (Optional) - labels: Array of strings sets label for each datase (Optional)
- meanline: If true, tries to render meanline as full width of box
- zorder: Sets the zorder of the boxplot (Optional)
Examples
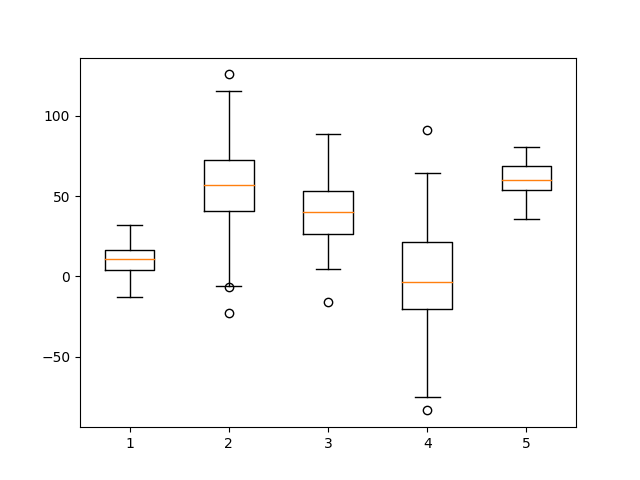
Basic example
import matplotlib.pyplot as plot
import numpy as np

np.random.seed(1)

#creating dataset
data1 = np.random.normal(10, 10, 100)
data2 = np.random.normal(50, 30, 100)
data3 = np.random.normal(40, 20, 100)
data4 = np.random.normal(0, 30, 100)
data5 = np.random.normal(60, 10, 100)
data = [data1, data2, data3, data4, data5]

fig, ax = plot.subplots()

#drawing box plot
ax.boxplot(data)

plot.show()
This would display something like this
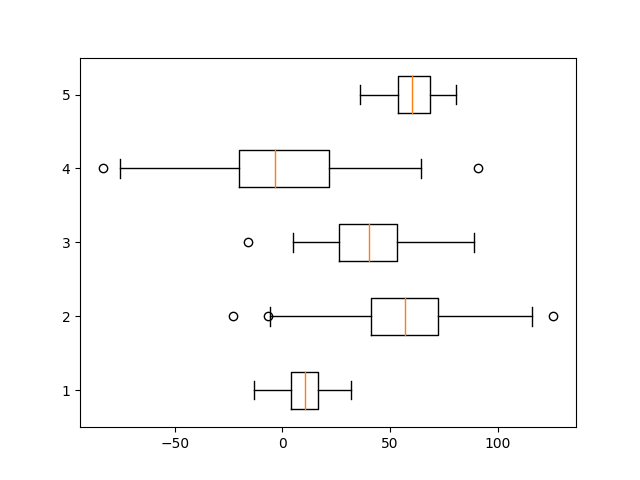
Horizontal example
By using vert parameter, a horizontal box plot can be created
import matplotlib.pyplot as plot
import numpy as np

np.random.seed(1)

#creating dataset
data1 = np.random.normal(10, 10, 100)
data2 = np.random.normal(50, 30, 100)
data3 = np.random.normal(40, 20, 100)
data4 = np.random.normal(0, 30, 100)
data5 = np.random.normal(60, 10, 100)
data = [data1, data2, data3, data4, data5]

fig, ax = plot.subplots()

#drawing box plot
ax.boxplot(data, vert=False)

plot.show()
This would display something like this