
![Java SE 11 Programmer I [1Z0-815] Practice Tests](https://static.shareasale.com/image/43514/728X909.jpg)

![Java SE 11 Programmer II [1Z0-816] Practice Tests](https://static.shareasale.com/image/43514/728X9026.jpg)
![Java SE 11 Developer (Upgrade) [1Z0-817]](https://static.shareasale.com/image/43514/728X9033.jpg)

1.5K
A histogram is an approximate representation of the distribution of numerical data.
To construct a histogram, the first step is to “bin” (or “bucket”) the range of values—that is, divide the entire range of values into a series of intervals—and then count how many values fall into each interval.
The bins are usually specified as consecutive, non-overlapping intervals of a variable. The bins (intervals) must be adjacent and are often (but not required to be) of equal size.
The matplotlib.pyplot.hist() function computes and draws the histogram of x, array or sequence of arrays.
Syntax
matplotlib.pyplot.hist(x, bins=None, range=None, density=False, cumulative=False, histtype='bar', color=None, edgecolor=None)
Parameters
| x | Required. Specify array or sequence of arrays. |
| bins | Optional. Specify the bins. It can be int or sequence or str. If bins is an int, it defines the number of equal-width bins in the given range. If bins is a sequence, it defines a monotonically increasing array of bin edges, including the rightmost edge, allowing for non-uniform bin widths. |
| range | Optional. Specify the lower and upper range of the bins. If not provided, range is simply (x.min(), x.max()). Values outside the range are ignored. It has no effect if bins is a sequence. |
| density | Optional. If it is set to False, the result will contain the number of samples in each bin. If True, the result is the value of the probability density function at the bin. |
| cumulative | Optional. If it is set to True, the histogram is computed where each bin gives the counts in that bin plus all bins for smaller values. |
| histtype | Optional. If can take value from {‘bar’, ‘barstacked’, ‘step’, ‘stepfilled’}.
|
| color | Optional. Specify color or sequence of colors, one per dataset. |
| edgecolor | Optional. Specify color for border of the bin. |
Examples
This is a basic example
from matplotlib import pyplot as plot
import numpy as np
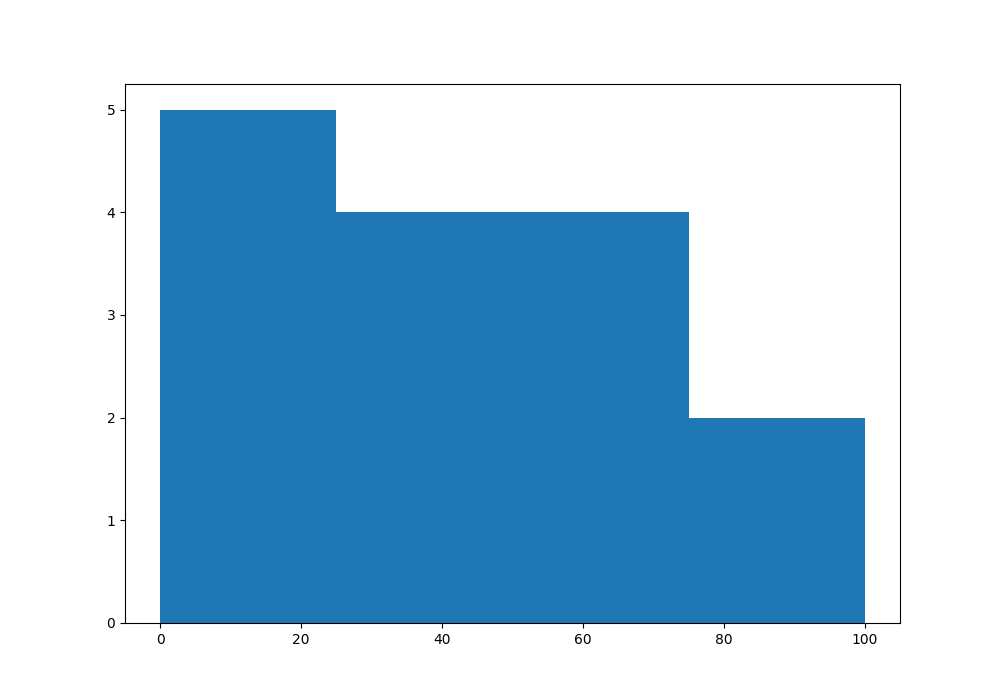
# Creating dataset
a = np.array([44, 92, 5, 63, 26,
73, 55, 64, 22,
33, 18, 8, 79, 13,
27])
# Creating histogram
fig, ax = plot.subplots(figsize =(10, 7))
ax.hist(a, bins = [0, 25, 50, 75, 100])
# Show plot
plot.show()
This is what is displayed
Cumulative histogram
You can specify cumulative to True, cumulative histogram can be created
import matplotlib.pyplot as plot
import numpy as np

#creating dataset
a = np.array([44, 92, 5, 63, 26,
              73, 55, 64, 22,
              33, 18, 8, 79, 13,
              27])
#creating bins
b = np.array([0,20,40,60,80,100])

fig, ax = plot.subplots()
ax.set_xlabel('Scores')
ax.set_ylabel('Pupils')
ax.set_title("Cumulative Histogram")

#drawing histogram
ax.hist(a, bins = b, cumulative=True, color="green", edgecolor='white')

plot.show()