Matplotlib is a comprehensive library for creating static, animated, and interactive visualizations in Python. Matplotlib makes easy things easy and hard things possible.
Bar charts
matplotlib.pyplot.bar(x, height, width=0.8, bottom=None, *, align=’center’, data=None, **kwargs)
Parameters:
x : sequence of scalars :The x coordinates of the bars. See also align for the alignment of the bars to the coordinates.
height : scalar or sequence of scalar : The height(s) of the bars.
width : scalar or array-like, optional : The width(s) of the bars (default: 0.8).
bottom : scalar or array-like, optional : The y coordinate(s) of the bars bases (default: 0).
align : {‘center’, ‘edge’}, optional, default: ‘center’ : Alignment of the bars to the x coordinates:
‘center’: Center the base on the x positions.
‘edge’: Align the left edges of the bars with the x positions.
To align the bars on the right edge pass a negative width and align=’edge’.
Examples
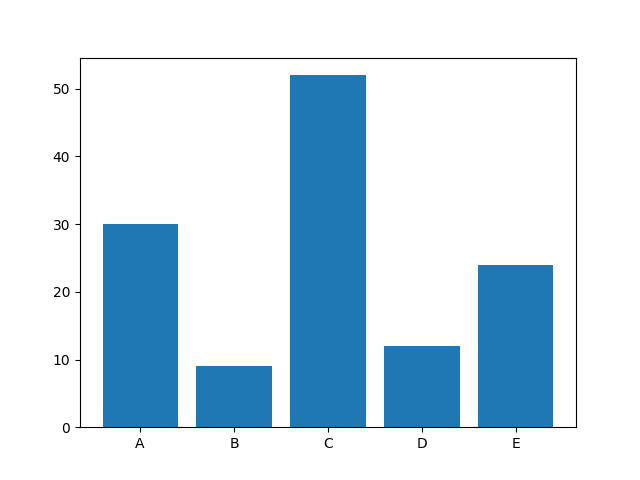
In the first Python example, we will create a basic bar chart using pyplot from the matplotlib library.
First, we declared two lists of width and height. Next, we used the Python bar function available in pyplot to draw this.
import matplotlib.pyplot as plot

x = ['A', 'B', 'C', 'D', 'E']
y = [30, 9, 52, 12, 24]

plot.bar(x, y)

plot.show()
Running this you should see something like this
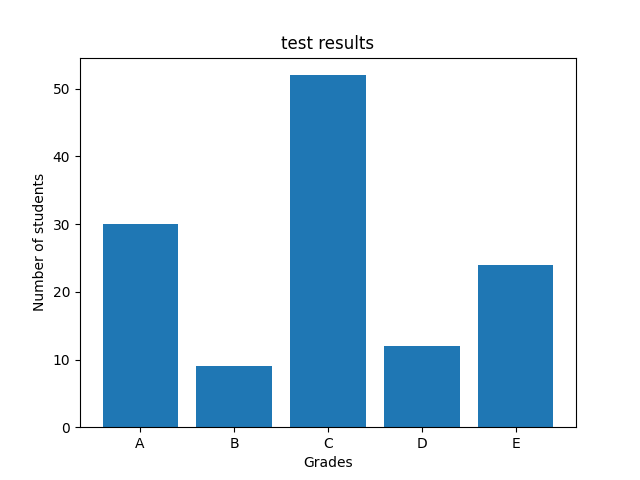
Now that is a good first example but you will notice that there is no title to the chart or labels for the X and Y axis, lets fix this
Matplotlib bar chart labels
import matplotlib.pyplot as plot

x = ['A', 'B', 'C', 'D', 'E']
y = [30, 9, 52, 12, 24]

plot.bar(x, y)

plot.title('test results')
plot.xlabel('Grades')
plot.ylabel('Number of students')

plot.show()
This will give you something like this
barchart with labels
Matplotlib bar chart grid lines
If you want to display grid lines in your Python bar chart, use the grid() function available in the pyplot.
Here is an example of this
import matplotlib.pyplot as plot

x = ['A', 'B', 'C', 'D', 'E']
y = [30, 9, 52, 12, 24]

plot.bar(x, y)

plot.title('test results')
plot.xlabel('Grades')
plot.ylabel('Number of students')

plot.grid(color = 'red', alpha = 0.5, linestyle = '--', linewidth = 1)
plot.show()
This will give you something like this
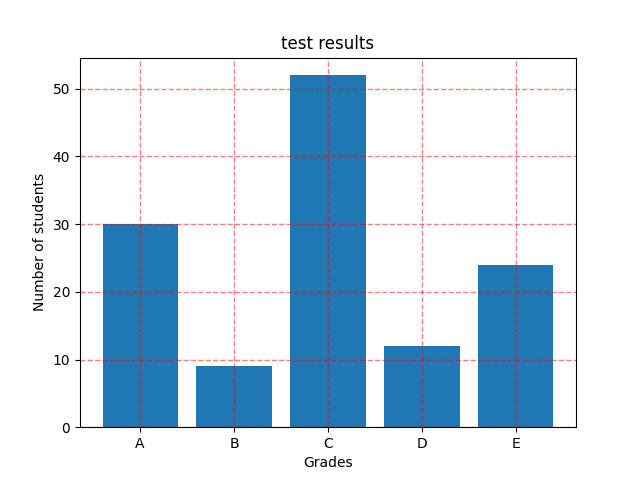
barchart with grid
Matplotlib Horizontal Bar Chart
The matplotlib library provides a barh function to draw or plot a horizontal bar chart in Python.
We swap the X axis and y axis naming as well, here is an example
import matplotlib.pyplot as plot

x = ['A', 'B', 'C', 'D', 'E']
y = [30, 9, 52, 12, 24]

plot.barh(x, y)

plot.title('test results')
plot.xlabel('Number of students')
plot.ylabel('Grades')

plot.grid(color = 'red', alpha = 0.5, linestyle = '--', linewidth = 1)
plot.show()
This will give you something like this
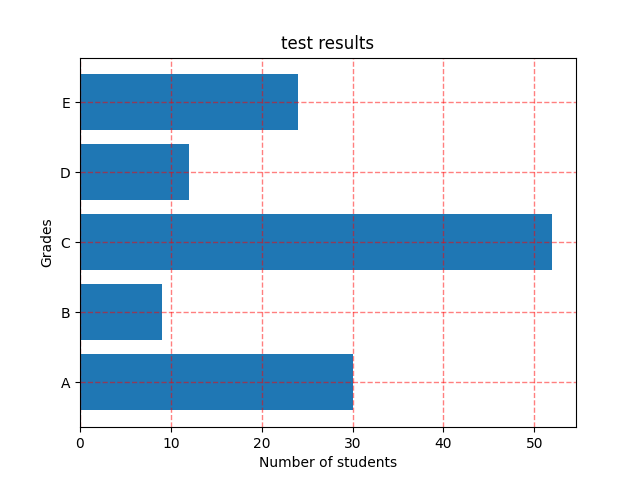
barchart horizontal
Matplotlib Bar Chart Colored bars
Use color argument to change the colors of the Bars, and edgecolor argument to change the color of the edges.
This is an example of this
import matplotlib.pyplot as plot

x = ['A', 'B', 'C', 'D', 'E']
y = [30, 9, 52, 12, 24]
colors = ['red', 'green', 'blue', 'yellow', 'cyan']

plot.bar(x, y, color = colors, edgecolor = 'black')

plot.title('test results')
plot.xlabel('Grades')
plot.ylabel('Number of students')

plot.grid(color = 'red', alpha = 0.5, linestyle = '--', linewidth = 1)
plot.show()
You should see a graph like this
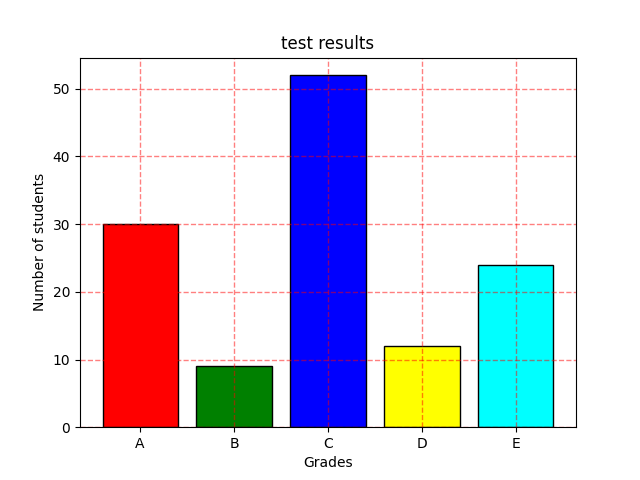
barchart colored bars
Matplotlib Bar chart more properties
Here is another example where we change the font size, alignment
import matplotlib.pyplot as plot

x = ['A', 'B', 'C', 'D', 'E']
y = [30, 9, 52, 12, 24]
colors = ['red', 'green', 'blue', 'yellow', 'cyan']

plot.bar(x, y, color = colors, edgecolor = 'black',width = 0.50)

plot.title('test results', fontsize = '20')
plot.xlabel('Grades', fontsize = '14')
plot.xticks(color = 'black',rotation = 45, horizontalalignment = 'right')
plot.ylabel('Number of students', fontsize = '14')
plot.yticks(color = 'blue',rotation = 45, horizontalalignment = 'right')

plot.grid(color = 'red', alpha = 0.5, linestyle = '--', linewidth = 1)
plot.show()
Styling the Python matplotlib Bar chart
There is also a variety of styles that you can use
from matplotlib import pyplot as plot
print (plot.style.available)
Which displayed the following
>> %Run matplotlibstyles.py
[‘Solarize_Light2’, ‘_classic_test_patch’, ‘_mpl-gallery’, ‘_mpl-gallery-nogrid’, ‘bmh’, ‘classic’, ‘dark_background’, ‘fast’, ‘fivethirtyeight’, ‘ggplot’, ‘grayscale’, ‘seaborn’, ‘seaborn-bright’, ‘seaborn-colorblind’, ‘seaborn-dark’, ‘seaborn-dark-palette’, ‘seaborn-darkgrid’, ‘seaborn-deep’, ‘seaborn-muted’, ‘seaborn-notebook’, ‘seaborn-paper’, ‘seaborn-pastel’, ‘seaborn-poster’, ‘seaborn-talk’, ‘seaborn-ticks’, ‘seaborn-white’, ‘seaborn-whitegrid’, ‘tableau-colorblind10’]
Lets use one of these
import matplotlib.pyplot as plot

x = ['A', 'B', 'C', 'D', 'E']
y = [30, 9, 52, 12, 24]
colors = ['red', 'green', 'blue', 'yellow', 'cyan']

plot.bar(x, y, color = colors, edgecolor = 'black')

plot.title('test results')
plot.xlabel('Grades')
plot.ylabel('Number of students')
plot.style.use('seaborn-darkgrid')

plot.show()